← FAA-CT-8080-2H figures
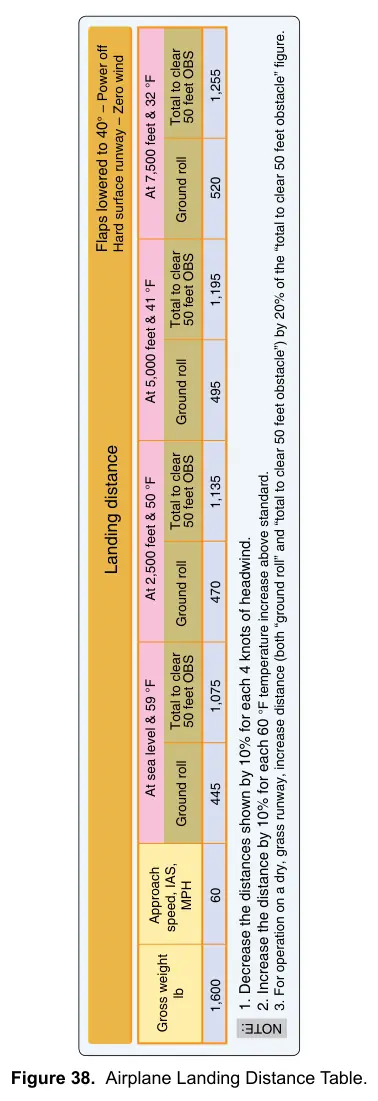
Figure 38: Airplane Landing Distance Table
Airman Knowledge Testing Supplement for Sport Pilot, Recreational Pilot, Remote Pilot, and Private PilotOfficial PDF RPARPHRPGPATPHTPOTPARPRHPROPOLPBHPBGPLAPPPPWSUAG
Practice
Sign in to practice with this figureText in this figure
Landing distance Flaps lowered to 40° – Power off Hard surface runway – Zero wind Gross weight lb At sea level & 59 °F At 2,500 feet & 50 °F At 5,000 feet & 41 °F At 7,500 feet & 32 °F Approach speed, IAS, MPH 60 1,600 445 1,075 470 1,135 495 1,195 520 1,255 Ground roll Total to clear 50 feet OBS Ground roll Total to clear 50 feet OBS Ground roll Total to clear 50 feet OBS Ground roll Total to clear 50 feet OBS 1. Decrease the distances shown by 10% for each 4 knots of headwind. 2. Increase the distance by 10% for each 60 °F temperature increase above standard. 3. For operation on a dry, grass runway, increase distance (both “ground roll” and “total to clear 50 feet obstacle”) by 20% of the “total to clear 50 feet obstacle” figure. NOTE: